What Is This Thing Called Decibel? |
|
There is no such thing as too many good articles about the decibel, and this "What Is This Thing Called Decibel?" piece from a 1931 issue of QST magazine is definitely a good read. Decibels are a very convenient method for calculating changes in power, voltage, and current levels due to it being based on logarithms, thereby changing multiplication and division operations into addition and subtraction operations, respectively. Once explained, some initial fear felt by newcomers is assuaged. Thereafter, the most difficult aspect of decibels is mathematically converting between ratios and decibels. In delving into some of the history of the usage of the decibel, co-author McLaughlin mentions the "R" system (Readability) of describing signal strength, as opposed to the modern "S" units - an interesting bit of historical trivia. Keeping in mind that this was written in 1931, it is not too surprising to read the author mention the somewhat recent transition from communications over copper wires to "radio circuits through space." What Is This Thing Called Decibel?
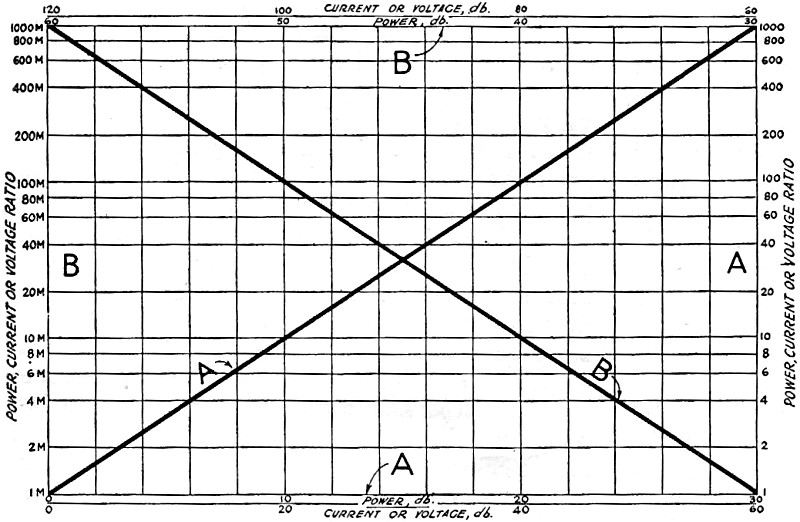
Fig. 1 - The Graphical "Gain" Table Coordinates marked "A" are used for the "A" curve and those marked "B" go with the "B" curve. Instructions for making up the curves and suggestions for their use are given in the text.
For Figure 1, "Gain" An Amateur View of the Transmission Unit By James L. McLaughlin * and James J. Lamb, Technical Editor Anyone who makes a practice of at least skimming through the technical literature of radio cannot have escaped noticing the increasingly frequent occurrence of "db" peppering its pages. Once pretty much restricted to papers and articles involving only telephony and broadcasting, it is now quite usual to find "db" popping up in technical stories which have little or no connection with wire telephony and often having but incidental relationship with telephony of any kind. Comparisons of the relative strengths of c.w. signals and the directivity of antennas, for instance, are surprisingly satisfying and meaningful when described simply in terms of decibels. And when something becomes satisfying and meaningful for the description of c.w. signals and the relative merits of antennas it becomes pronto one of those things that amateurs welcome to their circle and must needs adopt. True enough, amateurs in considerable numbers do have a friendly working acquaintance with the db; and its appearance in QST's pages is by this time no novelty.1 But it must be acknowledged that an aroma of mystery and the undeserved taint of "too technical" have become attached to the poor decibel, seriously handicapping its wholehearted adoption by many who have genuine use for it as a simplification in the handling of things radio - especially in the amateur field. Hence this little story; an attempt to do right by our little decibel and send it on its merry way to popularity with the ham of the species. How The dB Came to Be So far we have not so much as intimated what the family origin of our subject might be. For purposes of getting acquainted this matter is, of course, of some importance, even though we know that the origins of electrical measuring units are soon forgotten in the process of putting them to work on practical problems. Witness the general acceptance of the volt, the ampere, the watt, the ohm, as practical yardsticks for our radio measurements, with never a thought to their fundamental derivation. In fact, they have for us an almost physical reality - just as pints and quarts have to folks in other lines of more or less scientific endeavor. And so it is with the decibel. To hear those of the inner circle glibly bandy "db up" and "db down" is to marvel at the facility with which we technical people can take terms that have nothing more solid than abstract mathematical ratios as their basis and adopt them as genuine realities. That is what we have done with everyone of our electrical terms (who doesn't think of a 75-watter as having genuine physical dimensions?) and that is what we cannot help but do with the decibel. For just as the ohm is based on nothing more real than a mathematical ratio between volts and amperes, so the decibel is based on a mathematical ratio between power values. It differs slightly from other ratios in that it is logarithmic, which may seem discouraging but shouldn't, and it actually has a genuine physical meaning not possessed by most electrical units of measurement; it places power ratio and sound sensation as detected by the ear on a common basis. We "hear logarithmically"; our ears do not detect equal steps of loudness for equal steps in the power of sound but detect equal steps in a scale of loudness more nearly as equal steps in a logarithmic scale of sound power ratios. All of which may appear somewhat far-fetched and remote from the measurement of signal strengths and of antenna efficiencies until we recollect that amateur systems of communication invariably introduce the ear as the final piece of equipment; and that unqualified measurements in terms of volts, amperes, watts, and such do not fit the peculiarities of our personal listening apparatus. When It Started In the early development of telephony, a systematic relationship of electrical power ratio to sound sensation soon became necessary. To the telephone engineer, and to the radio engineer as well, sound is a commodity to be transformed and transported from producer to consumer through a transmitting medium. In the early days of electrical communication the medium was essentially a circuit of wire, but this has been extended more lately to include also radio circuits through space. Be the circuit wire or spatial, every piece of equipment in it between the source and a distant point means either a gain or loss in power level which must be translated to terms of sound value. Once upon a time different values in power level were simply but crudely specified as "a little louder," "not so loud," and so on - not even so exact as our old amateur "R" system of describing signal strength.
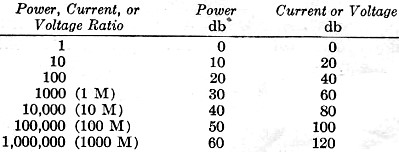
Fig. 2 - The "Loss" Table
For Figure 1, "Loss" In search for a measuring unit for expressing more definitely different values of power level in terms of sound value, the resourceful telephone people hit upon the idea of the "standard cable mile." This unit of power ratio was equivalent to the transmission loss of one mile of standard No. 19 telephone cable having a resistance of 88 ohms per loop mile and a capacity of .054 μfd. per mile. Of course telephone engineers could not be eternally lugging cumbersome reels of this cable around with them, and compact artificial cables containing lumped resistance and capacity were used as a necessary convenience. Now the "mile" unit had two characteristics, one good and the other not so good. The good one was that for speech the transmission loss of a "mile" quite closely represented the smallest step on a loudness scale that the ear could detect; the bad one was that it had a vicious frequency characteristic. It attenuated higher frequencies more than it attenuated the lower frequencies. It was not distortionless. This was not so serious where only" talking" tests had to be made, but when it came to making accurate measurements at single frequencies the thing became nearly meaningless. This was helped somewhat by adopting a standard frequency representative of speech, this frequency being first chosen as 800 cycles and later as 1000 cycles. Of course there was a lot more than this to the first epoch of power level measurement history, but this abridged version will suffice to bring us to the modern era. It does indicate, however, that the development of a completely satisfactory unit of power level measurement is not something that might occur accidentally along about the 37th CQ on a crowded Saturday night. Enter the Decibel As soon as the "mile" became so obviously unsatisfactory for the advancing art of electrical communication, the ever ingenious telephone engineers went gunning for a better unit which would not be greatly different in value from the old unit at speech frequencies, but which at the same time would be distortionless and hence more generally useful. This unit was not derived by the cut-and-try method which brought about the "mile," but originated on a slightly higher plane. It was born more through mathematical evolution, the process being best shown, perhaps, by a general example. Suppose we have a uniform signaling circuit (telephone or radio) having a length of n miles and suppose that the power at the input end of this circuit has a value of P1. Suppose we next measure the power at a point 1 mile from the source and designate this power value as P2. The ratio r of the two power values is P1/P2. Continuing the process, let us measure the power values at successive points each 1 mile further from the source. The successive power ratios will be found to be r2, r3, r4, etc., the ratio for a point n miles from the first point being rn, Very clearly, the power ratio is an exponential function of the length of the circuit. Coincidentally, it will be found that the sound level is directly proportional to the loop length of the line and hence to the exponential power ratio. Now let us put this power ratio in the form of a general equation: P1/P2 = rn This Logarithmic Business Now what we are after is the value of the exponent n as derived from the ratio of the two power values. Recalling what we may have forgotten about such things, or digging out the old "math" book if we can't recall it, we find that this exponential relation may be put in logarithmic form, equating the exponent to the other terms: n = logr (P1/P2) We are closer to the working version of the thing by this time, except for assigning a numerical value to r in the "log to the base r" part of it. Again going back to our school-day" math," we re-discover that there are two systems of logarithms in general use: The Naperian system in which the base, designated e, is 2.71828; and the Briggs, decimal, or common, system in which the base is an even 10. Both of these systems are used for expressing logarithmic power ratios, the Naperian system giving a basic unit called the "neper" and the decimal system giving a basic unit called the "bel." Our decibel is a subdivision of the latter and the base 10 is therefore the one for us. Now our logarithmic power ratio equation looks like this: n = log10 (P1/P2) bels Since it happens that the bel is too large a unit for practical work and since the old" mile" unit is approximately equivalent to a unit one-tenth the size of the bel, we divide the right-hand side of the above equation by one-tenth and obtain the expression for logarithmic power ratio in decibels: n = 10 10 log10 (P1/P2) db The two power values must be in the same units (kilowatts, watts, milliwatts, microwatts - or horse power). If the ratio of the two power values is greater than unity there is positive gain and if the ratio is less than unity there is negative gain or loss. A ratio of unity of course gives zero gain. Since it is usually more convenient to measure voltage or current values than it is to measure the power directly, when the power is proportionate to the square of the current or voltage, as in a circuit of pure resistance,
Likewise,
Strictly these relations hold only so long as the circuit conditions are the same for the two measurements of either current or voltage. As has been pointed out in a previous publication2 a correction must be applied where the conditions are different for the two measurements. This will work no hardship in most cases, however, especially where we are concerned with changes in power level at only one point in a circuit. This will be generally true in amateur problems. Because of the logarithmic character of the decibel, successive gains and losses expressed in db are added algebraically. For instance, suppose we have a system containing successively an amplifier giving a positive gain of 20 db, a line having a negative gain (loss) of 5 db, an impedance-matching network giving a negative gain (loss) of 30 db, and ending up with an amplifier contributing a positive gain of 10 db. The overall gain of the system, from the input of the first amplifier to the output of the terminating amplifier, would be. +20db-5db-30db+10db = -5db. This feature in itself contributes considerably to the simplification of power level calculations where there are a number of pieces of equipment between the input and output terminals of a system. Once the gain for each piece of equipment is known, providing the couplings have proper characteristics, it is necessary only to perform a simple addition to determine the gain for the whole system. Eliminating the Math Now that we have dutifully traced the mathematical evolution of the decibel - we trust it has been followed just as dutifully - the time has come to disclose the inevitable short cut which eliminates the mathematical computations involving log tables, slide rules, and such. The method is graphical and employs another mathematical trick. Using "semi-logarithmic" graph sheets on which the ordinates form a geometric progression while the abscissae form an arithmetical progression, power and current or voltage ratios are plotted against db values, the resultant curve being a straight line. Figs. 1 and 2 illustrate such graphical tables covering power ratios from one one-millionth to a million with corresponding db values of from -60 to +60. They also cover voltage or current ratios of from one one-millionth to one million with corresponding db values of from -120 to + 120. These ranges are adequate for all practical purposes since it is quite unusual to encounter gains or losses greater than these values. Since the graphical tables reproduced here are somewhat small for practical work, it is recommended that they be used as models for larger ones plotted on graph sheets of the semi-logarithmic type, such as Keuffel & Esser No. 358-72L. These sheets can be obtained in stores that handle draftsman's supplies. The preparation is quite simple, consisting only of the notation of the coordinates and the drawing of the diagonal straight lines. It would be less confusing, perhaps, if separate sheets were used for ratios below 1000 ("A" curve) and over 1000 ("B" curve) of Fig. 1, and for the "A" and "B" curves of Fig. 2. Then there would be but one curve on each sheet. The following table can be used in plotting the points for the curves: The ratios are marked on the logarithmic vertical scales and the db values are marked on the horizontal linear scales. Coordinates designated "A" are used for the "A" curves and coordinates designated "B" are used for the "B" curves. Once the curves have been plotted they can be used directly for translating power, current, and voltage ratios to db values; or they can be used for translating known db values to power, current, and voltage ratios. They work either way and completely eliminate the bother of juggling logs and antilogs. Let's try a few examples. R may be a 500,000-ohm potentiometer, preferably of the "tapered" type giving a logarithmic resistance vs. knob rotation curve, as explained in the text. R1 is the usual cathode bias resistor used with heater type tubes and condensers C1 serve as by-passes. Some Practical Applications
Fig. 3 - A Simple Type of Volume Control Which Can Be Calibrated to Indicate Power Level One of the things in which every amateur is vitally interested is the probable improvement in performance accompanying a change in his transmitting equipment. Who has not made adjustments that have resulted in increased output, as measured by the antenna ammeter, and then found that there has not been a proportionate improvement in signal strength as measured in audibility by a distant observer? Suppose we take a typical example and see how it works out. Without changing the frequency or antenna tuning adjustments, the plate voltage on the transmitting tubes is raised so that the antenna current increases from 1 ampere to 1.5 amperes (representing a power increase of 2.25 times). What should be expected in the way of improvement in signal strength, other things remaining unchanged? The current ratio is 1.5, which, from curve"A" of Fig. 1, is seen to represent a gain of 3.5 db. Remembering that the least increase in level that is detectable by the ear is 1 db and that it takes as much as 2 or 3 db increase to make a showing in the presence of QRM, etc., it is obvious that the increase of 50% in antenna current will not do much more than bring the signal up about one notch in the "R" scale of audibility. If the signal were R4 with 1 ampere antenna current, it wouldn't be much over R5 with 1.5 ampere in the same antenna at the same frequency. Of course this is neglecting the non-linear response characteristic of the receiver (regenerative detector sensitivity is much greater for weak signals), but even then the increase in signal strength is more nearly represented by the gain in db than by the showing on the antenna ammeter. Here is a more general problem. Suppose Bill Jones is contemplating building a new transmitter to replace his present Type '10 outfit which has an output of 10 watts. What improvement in signal strength could he expect from a set using a Type '52 and putting 100 watts into the same antenna system and on the same frequency? The power ratio is 10 and the gain is 10 db, as an inspection of curve "A" of Fig. 1 will reveal. This gain will represent something like 3 or 4 steps in audibility on the R scale so that if his signals were around R4 at Washout, N. D., with the old outfit, he might expect R7 and R8 with the larger outfit under the same conditions. Or suppose we wish to know the improvement that can be expected with an increase in the modulation capability of a phone. transmitter. The power of the modulator is increased so that the modulation capability is made 90% instead of 30%, the carrier power remaining the same. What is the gain in db? Since the antenna current amplitude is proportional to the percentage of modulation, the improvement in modulation capability will represent a current ratio of 3. From curve "A" of Fig. 1 it is seen that this is a gain of nearly 9 db - no mean improvement in the sock of that particular phone set. Passing on from the transmitter itself to the antenna system, suppose that W2SOX decides to add a little directivity to his 28-mc. antenna and that the particular combination he decides upon gives a rated gain of 6 db in the direction towards which he wishes to push his signals. To what is this equivalent in terms of power increase in a non-directive transmitting antenna? Consulting Fig. 1, curve"A," we find that the power ratio for a 6 db gain is 4. The directive antenna, therefore, gives him the same increase in signal strength as he would obtain by increasing the power - in the non-directive antenna to 4 times its normal value. Since the array necessary to give this gain might consist of nothing more elaborate than two "couplets," each consisting of a half-wave antenna-backed up by a reflector spaced a quarter-wave behind it, with the two antennas excited in phase, it is obvious that directive transmission is decidedly advantageous. The Standard Reference Level The decibel is primarily a unit that is used to specify gains and losses with reference to the power value at some point in a system, irrespective of what the actual value of the reference power may be. Since the unit is based on a power ratio, however, it is natural to assume a standard reference power value and use the db to express amounts of power as being so many db above or below this value. Several reference levels have been more or less generally used, but the standard in broadcast and allied fields at the present time is 0.006 watts or 6 milliwatts. When a broadcast engineer says that a microphone is"30 db down" or that his level is "plus 8 db," he has this reference power in mind. Practically all the broadcast and telephone equipment used in this country at the present time is rated and calibrated on the basis of this reference level. When a pick-up amplifier is rated as having a "maximum undistorted output level of 6 db," it means that the power output is 6 db (power ratio of 4) above 6 milliwatts or that it is 24 mw. A fairly accurate picture of the meaning of loudness in terms of the standard reference level of 6 mw. can be obtained from the following approximations: Good R9 signal strength on a telephone headset is about +2 db; loud, loud-speaker volume is about +20 db. A reference level of 10 mw. is sometimes used, but unless otherwise specified the reference power of 6 mw. can be assumed. Measuring Power Level There are several types of audio-frequency power level measuring devices in general use. One type which is self-contained and requires no battery supply for its operation is that in which a rectifier type voltmeter is used as the indicating instrument in conjunction with a variable attenuator made up of suitable resistors and calibrated in db. This type is usually designed for operation across a 500-ohm line. A voltmeter reading of 1.7a volts corresponds to zero db level for a reference power of 6 milliwatts when the instrument is connected across a 500-ohm line. The voltmeter scale is calibrated from -10 db to +6 db and the attenuator which is calibrated from 0 to 30 db further extends the use of the instrument - something like connecting a resistance in series with a low-range voltmeter to increase its range. The attenuator for this type of indicator necessarily must be so designed as to present a constant input impedance in order to prevent its affecting the frequency characteristic of the line to which it is connected. The variable attenuator is usually of the"L" type in which a series and a shunt resistance element are varied simultaneously. The design of attenuation networks is a whole story in itself and will constitute a separate article in a future issue of QST.
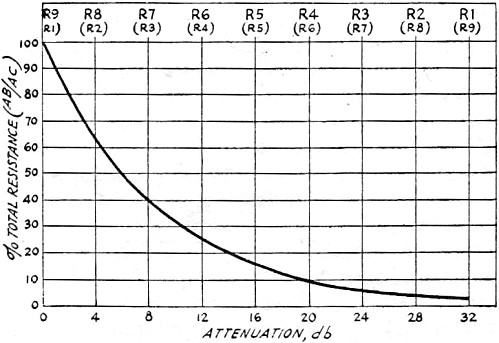
Fig. 4 - Illustrating the Relation Between volume-control resistance ratio, db level, and audibility. The audibility figures in parentheses suggest a calibration for audibility measurements on received signals. Details are explained in the text. A second type of power level indicator is that in which a vacuum tube is utilized as a v.t. voltmeter. This type is more adaptable to amateur uses and has been treated in a previous QST article.3 A modification of this arrangement is generally used as the volume or "gain" control in amateur receivers and in the speech amplifiers of phone transmitters, the attenuator being connected as a voltage divider in the grid circuit of an audio amplifier as shown in Fig. 3. Such a simple attenuation arrangement can be used only where there is practically no current flowing through the resistor and where the impedance into which the attenuator system couples is much higher than the resistance of the attenuator. These conditions are satisfied in the grid circuit of an audio amplifier such as that illustrated. The position of the sliding contact or tap-switch on the resistor R determines the value of the signal voltage applied to the grid circuit of the amplifier tube, the ratio of the voltage on the grid to the total voltage across the secondary of the transformer being proportional to the ratio of resistance AB to the total resistance AC. But the volume level will not be proportional to the ratio of the resistance values. If the potentiometer is of the type having a straight-line resistance vs. knob-rotation curve, the volume level will not be decreased noticeably until the gain has been backed off about 1/3 of the total sweep of the knob. And there will not be a noticeably rapid decrease in volume level with decrease of the resistance AB until the contact has gone past the half-way mark. This is shown graphically in Fig. 4, where attenuation in db has been plotted against per cent total resistance for a voltage divider such as that shown in Fig. 3. A rough comparison of the resistance ratios and signal strength in terms of the "R" system of audibility is also indicated in Fig. 4, steps of 4 db each having been allowed for each step in the "R" scale. The total attenuation between R9 and R1 is shown as 32 db, which may be taken as a practicable approximation. Since the relation between resistance ratio and volume level is a logarithmic one, it is obvious that the calibration of the potentiometer scale should be logarithmic or that a logarithmic "tapered" resistor should be used. The latter is the more practicable arrangement, since the scale calibration can then be linear with respect to rotation of the control. A receiver volume control having a logarithmic resistance characteristic could be used to good advantage as an audibility meter by making its calibration the reverse of the"R" scale shown in .the chart of Fig. 4 (as indicated by the parenthetical figures). The angular scale could have ten divisions with "10" at the zero resistance position and "1" at the maximum resistance position. A signal which was R9 would just go out of audibility at the next position above zero resistance while a signal that was R1 would be just audible with the resistor in the full "on" position. If desired, the resistor could be calibrated in db instead of in "R" units of audibility. The latter calibration would be especially applicable to the gain control of the speech amplifier of a phone transmitter. These are but a few of the many ways in which the db can be put to work in amateur radio. Even to mention all the possible uses would run this story beyond page 98 - and it is long enough now. But we hope that the suggestions that have been made and the information that we have tried to give will serve to further the adoption of the db by amateurs. It is inevitable that we shall hear more of the thing, as future QST articles will show. We cannot escape it. Perhaps it even may be heard of over the air; "your sigs up 4 db now, OM - FB."
* Aviation Radio Station, Inc., 29 West 57th St., New York City. 1 Particularly "Some More About the Family," Chamberlain, QST, July, 1928; and subsequent articles on volume level indicators, directive antennas, etc. 2 "Notes on Power Measurements in Communication Circuits," Crawford, General Radio Experimenter, October, 1929 3 "Volume Level Indicators," Omer, QST, November, 1930; and correction in following issue. Figs. 2 and 5 of this article should be interchanged.
Posted March 10, 2022 |
|