Power Ratings & Intermodulation Tests
|
|
Although this article discusses audio waveform measurements, the lesson learned applies equally well to any waveform frequency. In the RF realm, we are accustomed to injecting two sinewaves at equal amplitudes into a unit under test (UUT) and reading the relative output powers of the two input signals and the n-order intermodulation (IM) signals. It is usually a very simple test with simple to interpret results handily shown on the display of a spectrum analyzer. The task is made a bit more difficult when injecting signals of unequal strengths and especially when measuring in units of voltage as a viewed on an oscilloscope display. I dare say most of us need to do some head scratching and looking up of formulas to pull off such a measurement. Power Ratings & IM Tests
Be careful of what power rating you are quoting when checking hi-fi units for IM distortion. We had sold the amplifier kit, a well known 60-watt basic amplifier, only a few days before and we now had a pretty unhappy owner on our hands."This amplifier won't come even close to putting out 60 watts without terrible distortion," he said with disgust. "There must be something loused up with it!" "How do you know it's not putting out its rated power?" we asked. "Does it sound bad or overload easily?" "Well, no, it seems to sound pretty good. But a friend of mine came over with his IM distortion analyzer and measured it for me. About the most it would do was 40 watts, and that's a far cry from the 60 watts it's supposed to deliver:" Further questioning revealed that he had, in fact, been quite pleased with the sound quality produced by his new amplifier, but since it had been measured and found wanting, it no longer seemed to sound quite right. We set up the amplifier on the test bench, loaded it into our 300-watt non-inductive load, clipped the scope across the output terminals for visual observation of the waveform, and proceeded to check it out. Everything seemed in order. We touched up the bias adjustment slightly and, with rated output, measured considerably less than one percent intermodulation distortion. Our "friend" kept his eyes glued to every move that was made. "It's doing a real good job," we said. "It's running about six-tenths of one percent distortion at 60 watts." "Wait a minute, now; what scale are you. reading on the wattmeter?" he inquired with a skeptical glance. "Read the power on the 150-watt scale," we replied. "But that's not showing 60 watts; that indicates only about 40 watts, just as I said!" "True," we agreed, "but you must remember that we are not measuring a simple sine wave. We are using a complex wave consisting of two sine waves: one at a frequency of 60 cycles per second, and the other at a frequency of 7000 cycles mixed together in a voltage ratio of four-to-one respectively. With such a complex signal, the wattmeter reading must be multiplied by a factor of 1.47 to obtain the equivalent single sine-wave power." It was apparent that we were not getting through. "Look," we said, "let's feed a single-frequency sine wave into the amplifier and adjust the input until the wattmeter reads 60 watts." The scope showed a beautiful waveform, and the amplifier delivered 60 watts easily. "Now, notice the vertical deflection on the scope. We adjust the gain of the scope until the pattern covers exactly ten divisions. But see what happens when we add the 7000-cycle signal which was preset to equal just one-fourth the value of the 60-cycle signal: the amplifier is obviously overloading. Next we reduce the combined input signal until the scope shows the same ten-division deflection that we saw corresponded to a power output of 60 watts. Then we are still driving the amplifier to its maximum peak-power output, but because we are no longer measuring a simple sine wave, and because the wattmeter happens to be an average-power instrument, the wattmeter shows the true average power output of 40.8 watts." "You mean that a sixty-watt amplifier can overload even when it's producing only 40 watts output?" he asked incredulously. "Absolutely! As a matter of fact, it can overload when it is putting out much less than 40 watts average power, depending on the waveform it is handling. With some very complex waveforms generated by many kinds of music, it is entirely possible that an average power output of only a few watts could demand peak powers in excess of the capacity of the 60-watt amplifier:
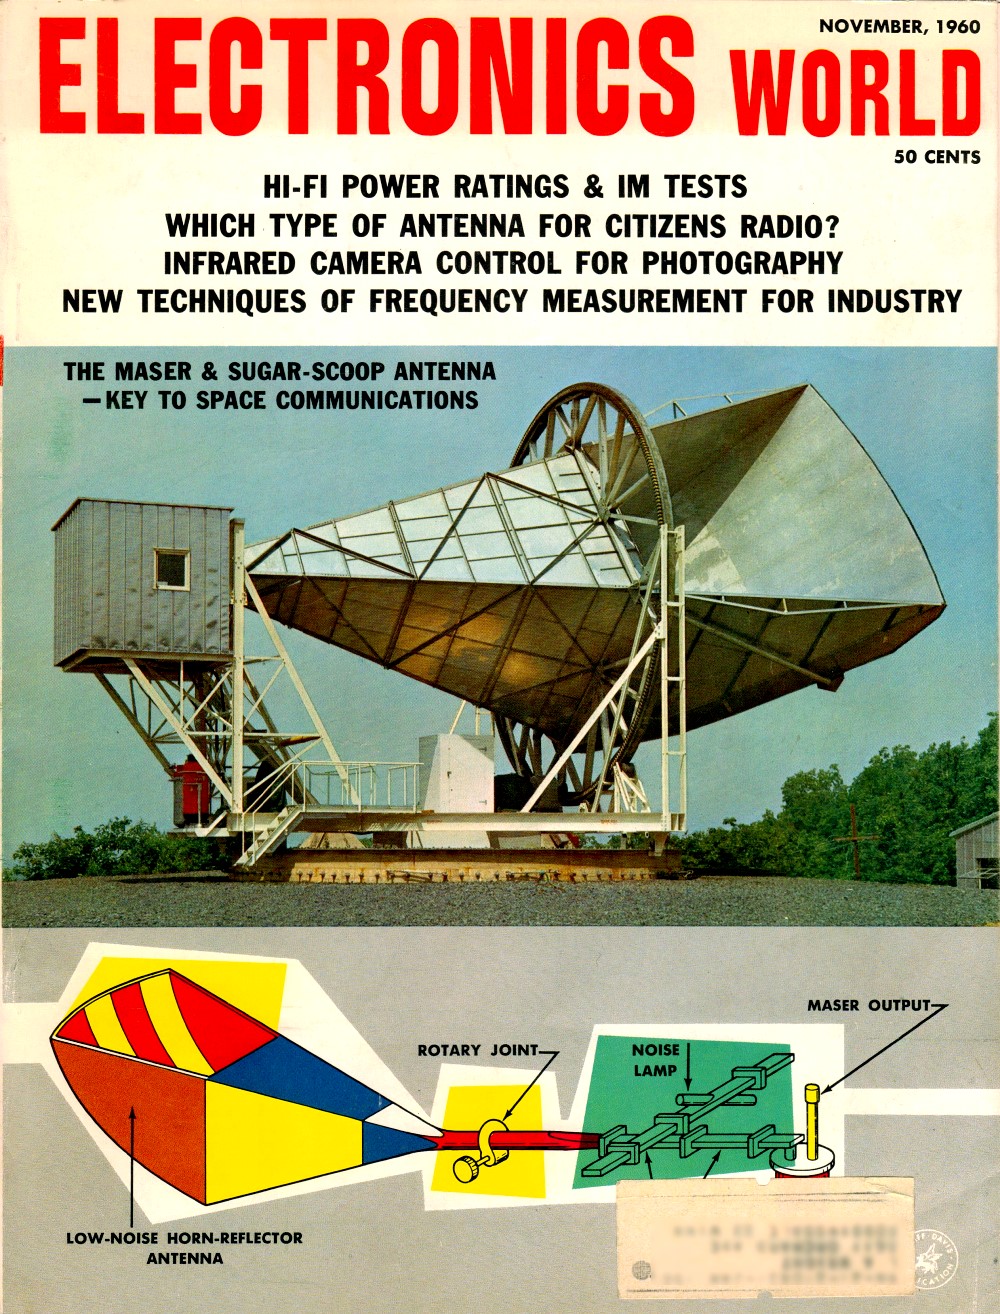
Fig. 1 - With a single-frequency sine-wave signal applied to the amplifier, these are the output power relations. "In many ways, it would be better if we used the peak-power output rating for amplifiers rather than average-power ratings, because when an amplifier is producing its maximum peak-power output, this is its limit no matter what the average-power output may be. With a single sine-wave signal, the peak-power output is exactly twice the value of the average-power output. In other words, when your amplifier was delivering 60 watts as measured by the wattmeter when using the single sine-wave signal, it was necessarily and mathematically producing 120 watts peak-power output. This simple two-to-one ratio is true only for a simple sine-wave input. With complex waveforms, the ratio can be many times as great. With the 4-to-1 ratio signals used in intermodulation distortion measurements, the ratio of peak-to-average power is 2.94 to 1, and as the wave becomes more complex the ratio in general becomes even larger. "When your friend measured the distortion at an indicated power of 40.8 watts, he was actually measuring the distortion with the amplifier delivering 120 watts peak power with the complex wave and that's all the amplifier can deliver." "Then the amplifier is really all right?" "Yes, sir. It's doing even better than the specifications call for and we're certain you will be completely satisfied with its performance. And, by the way, ask your friend with the analyzer to come in for a chat, will you?" Improper Power Ratings Misunderstandings and dissatisfaction occur repeatedly in connection with IM distortion measurements caused by improper evaluation of amplifier output when using complex waveforms, despite words of caution from the manufacturers of the test equipment. Let's look into the problem a little more deeply. Let's assume we have an amplifier set up and adjusted in such a manner that with an input signal of 60 cycles per second measuring one volt on a meter indicating r.m.s. value, an average power output of ten watts is produced in a 16-ohm load. Elementary a.c. theory tells us that the peak value of the input voltage is 1.414 times the r.m.s. value or, in this instance, 1.414 volts peak. Looking at the output side of the amplifier, we would measure an r.m.s. voltage across the load of 12.65 volts with a corresponding peak value of 1.414 x 12.65 = 17.89 volts, as in Fig. 1. Using the well-known relationship: Power = E2/R we find average power is power is Here again, we find the situation where the peak power is exactly twice the average power, using a single sine wave. Now, if we remove the 60-cycle, 1-volt signal and substitute a 7000-cycle, 1/4-volt signal with all other adjustments unchanged, we find the peak value of the input signal is 1.414 x 0.25 = 0.3535 volt. At the load we now find an r.m.s. voltage of 3.1625 volts with its corresponding peak value of 4.4725 volts. With the 1/4-volt input signal we find average power is
peak power is watts and again, since a single sine wave is involved, the ratio of peak-power output to average-power output is two-to-one.
Fig. 2 - When two frequencies are applied for an intermodulation distortion test, the picture changes considerably. In intermodulation distortion measurements, these two above signals are mixed or added together, and the higher frequency component "rides" on the lower frequency signal as shown in Fig. 2, producing a combined-signal peak voltage that is 1.414 plus 0.3535 = 1.7675 volts at the amplifier input. At the output, assuming no overloading we find a peak voltage equal to the sum of the two separate peak values or 17.89 plus 4.4725 = 22.36 volts. This value of peak voltage indicates a peak power of
Yet the average power with the combined signals is actually the same as if each of the two signals operated independently, or 10 plus 0.625 = 10.625 watts. Hence it is seen that adding the high-frequency signal to the larger low-frequency signal adds only 0.625 watt to the average power output while at the same time, it increases the peak-power output from 20 watts to 31.24 watts. A single sine wave that would produce a peak-power output of 31.24 watts would have an average-power output of one-half this amount or 15.62 watts. Thus we say the above complex signal produces an equivalent sine-wave power of 15.62 watts. The ratio of the equivalent sine-wave power to the actual average power is therefore 15.62/10.625 or 1.47. Hence, if the wattmeter used to measure power responds to average power, it will be necessary to multiply the indicated reading by the factor of 1.47 to obtain the equivalent sine-wave power. Likewise, if a voltmeter is used to measure the output voltage across the load, and power output computed from this measured voltage, and if the voltmeter responds to the r.m.s. value of voltage, the power output computed from the meter reading must be multiplied by the same 1.47 factor. Other Instruments If the wattmeter or voltmeter used to measure power responds to the peak value, no correction factor should be used since the meters will be indicating equivalent sine-wave power or voltage. Different types of instruments respond Differently to the same a.c. wave. Thus in addition to those that respond to peak values, simple rectifier or diode types produce a deflection in an d'Arsonval meter movement proportional to the average value of the rectified wave; thermocouple, electrodynamometer, moving-iron, and electrostatic type instruments produce a deflection proportional to the r.m.s. value of any waveform. Vacuum-tube voltmeters may produce a deflection which range from proportionality to the average value up to the peak value, depending upon the design of the instrument. Where available, the oscilloscope may be used to adjust the output of the amplifier under test to have the same peak output with the complex wave as it had with the single sine wave of known power output. Then the amplifier will have the same equivalent sine-wave output when using the two-frequency test signal. Should there be some uncertainty as to just what the wattmeter or voltmeter is responding to, a simple test may be performed to determine "watts what." Adjust the amplifier under test to produce a power output of about half its rated power output, using a 60-cycle signal of known voltage at the input. Introduce the 7000-cycle signal of a value just one-fourth that of the 60-cycle voltage. The indicated power output should then increase 56.2% and the indicated output voltage should increase 25%. Should these percentages not be obtained, it is a simple matter to determine from the observed increases, how much correction factor is required for the particular meter in question to obtain the necessary percentage increases. It must be remembered that the correction factors so determined are valid only for two-frequency signals mixed In a four-to-one ratio for "the particular meter in question.
Posted March 22, 2022 |
|


 = 10 watts peak
 = 20 watts.
 = 0.625 watt
 = 1.25
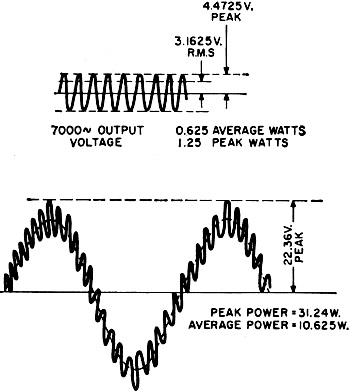
 peak watts.