Applications & Media Data Bandwidth (2006) |
|||||||||||||||||||||||||||||||||||||||||||||||||||||||||||||||||||||
|
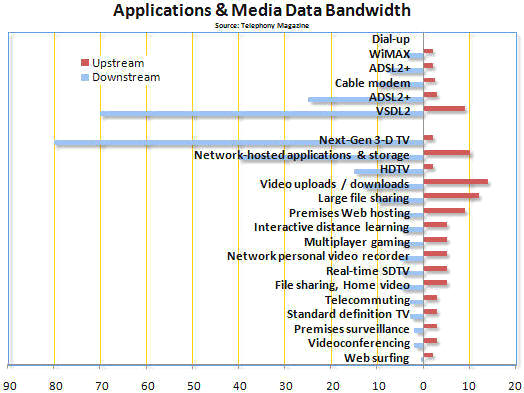
The chart below represents the state of applications and media data bandwidth usage as of 2006. The information was obtained by a story in Telephony magazine, entered into an Excel spreadsheet, and plotted as shown. Downstream values are speeds from the server to the local user computer, and upstream is from the local user to the server. Note that blue bars to the left of the divider are for downstream data, and red bars to the right of the divider are for upstream data.
Megabits per Second Note: Values are approximate and represent circa 2006 information.
|
|||||||||||||||||||||||||||||||||||||||||||||||||||||||||||||||||||||