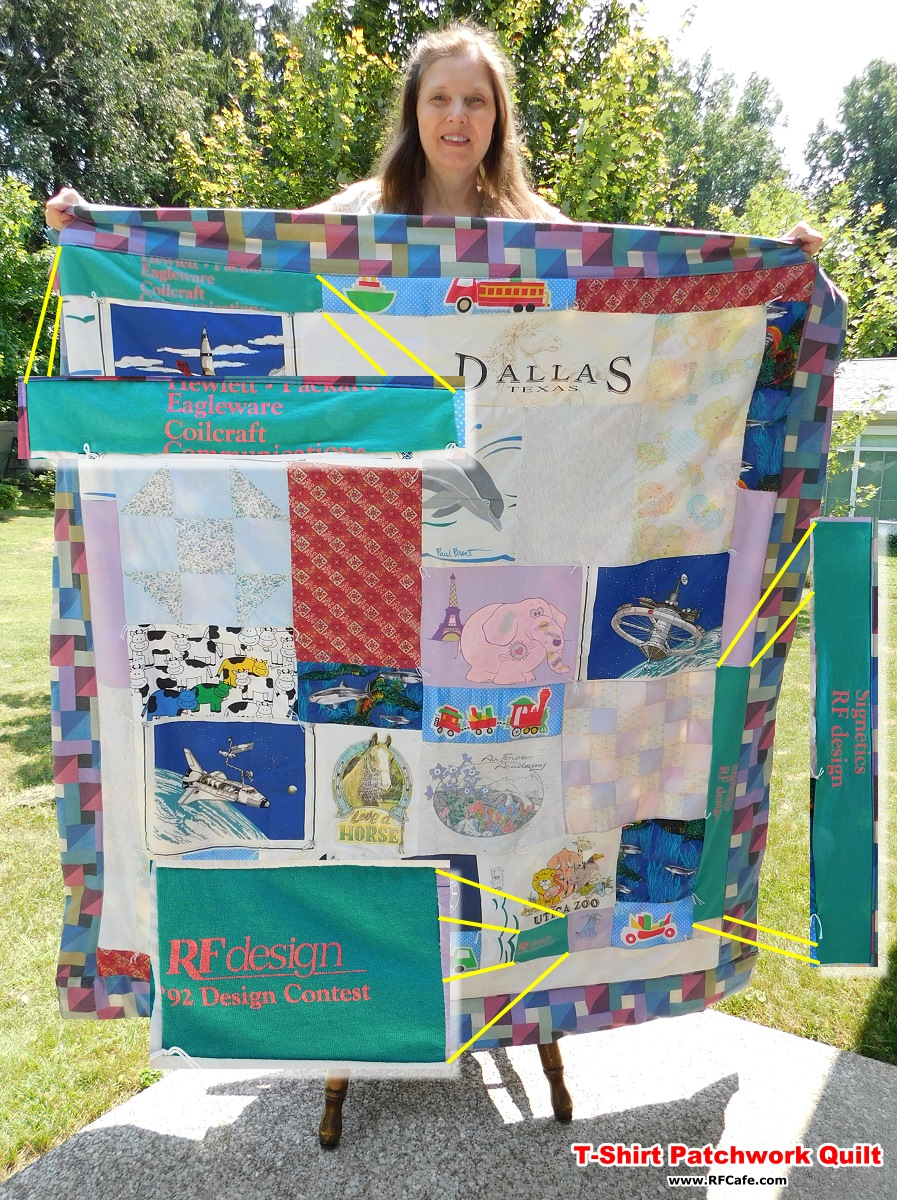
Parts of "RF Design" software contest T-Shirt prize sewn into
patchwork quilt.
Wayyyy.... back in 1992, RF Design magazine (Gray Breed was editor at
the time) ran a software contest. Those were the days when most engineers and hobbyists
wrote software in either Basic or Fortran. I happened to use Turbo Pascal, by Borland
(now called Delphi, by
Embarcadero). At the time, I was working as an RF engineer for Comsat, in Germantown,
Maryland. Having done a lot of frequency conversion designs in my previous work
at General Electric, and even more there at Comsat, I had already written a crude
program to calculate mixer spurious products, so this challenge gave me the excuse
I needed to refine the user interface and add some creature comfort features like
loadable mixer spur files and detection of spectral inversion if present.
Although I did not win the grand prize, I did win the runner-up prize (along
with, I think, a couple other people). The prizes included having the following
article published in the November 1992 edition of the magazine, a couple experimenter
kits of surface mount inductors and resistors, a T-shirt (which I still have), and
a couple other items. Of course, the greatest prize as far was I was concerned was
having an article published in a major magazine.
Here is a scanned and OCRed version of the article that appeared in the November
1992 edition of RF Design. The original pages are an the bottom of the
page.
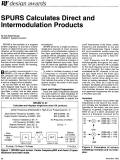
SPURS Calculates Direct and Intermodulation Products
By Kirt Blattenberger COMSAT, Systems Division
|
SPURS is the evolution of a program written originally to provide a simple means
of determining spur products. However, as the program was used both by the author
and his fellow engineers, it became clear that some user-friendliness would be a
nice addition. Over the years much has been incorporated in the form of error trapping,
input and output display screen format, file handling, and on-line help screens.
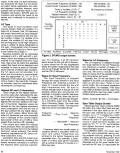
Basic system requirements
to run SPURS v1.01 are an IBM-compatible computer with 125 kBytes of free RAM, and
a text screen. Color is nice but not necessary. Running from either a hard or a
floppy drive is possible. As can be seen on the input screen block diagram (see
Figure 1), the system is modeled as a cascaded ideal input filter, a mixer, and
an ideal output filter. The operator can select either a fixed local oscillator
(LO) or a variable LO. Both up and down conversions can
|
be analyzed. SPURS performs a single-conversion, single-tone analysis of mixer
spurious products using parameters entered in the input parameter screen. Spurious
products will be calculated according to jLO ± kRF and kRF ± jLO, where j and k
are integers for harmonics entered in the Highest Harmonic input lines. Spurs that
fall within the specified output filter bandwidth will be displayed and recorded.
In order to facilitate choosing a fixed LO frequency or variable frequency range,
SPURS calculates the low-side and high-side LO center frequencies that translate
the center of the input frequency range to the center of the output frequency range.
Input and Output Frequencies
Input and output frequencies describe the cutoff points for ideal bandpass filters
at the input and output of the mixer. Two forms are possible to specify the
|
cutoff frequencies of the filters, center frequency and bandwidth or low and
high cutoff frequencies. Figure 1 shows the input parameter screen when the center
frequency and bandwidth input format is used along with a fixed frequency LO. Input
Frequency and RF are used interchangeably throughout this document. The use of the
term RF is avoided for the input frequency since in the case of an up converter
the output may be considered the RF. However, in the output spur table and in the
mixer spur level files, RF is used to designate the harmonic number since doing
so conforms to industry standards. Frequency units (Hz, kHz, MHz, etc.) must be
kept constant. Six places are provided for frequency inputs in order to allow a
span of nine decades between the lowermost and uppermost frequencies with at least
a two place accuracy.
Inversion
Frequency inversion occurs when high frequencies at the input of the conversion
process are translated to low frequencies at the output, and vice versa (Figure
2). In general, a high-side LO on either an up or a down conversion will result
in a frequency inversion at the
Figure 2 - Examples of mixers exhibiting inversion and no inversion.
|
|
Figure 1 - SPURS input screen. Center frequency/BW and fixed
LO specifications have been made.
|
|
output. In the case of a dual conversion, two inversions will result in a non-inverted
output. Some applications can tolerate frequency inversion; however, voice systems
with an inversion result in unintelligible information. SPURS tests for inversion
and reports the result to the screen and, if selected, to the printer or disk file.
LO Type
Two types of local oscillators (LO) may be chosen: fixed and variable. If a fixed
LO is chosen, that LO frequency will remain fixed while the input frequency is swept
in accordance with the chosen number of steps. If a variable LO is chosen, the variable
LO will step from the low frequency to the high frequency using a number of steps
designated by the user. Computation time increases over the fixed LO case by a factor
equal to the number of LO steps + 1. Spurious products will be calculated according
to jLO ± kRF and kRF ± jLO, where j and k are integers for harmonics entered in
the Highest Harmonic input lines. Spurs that fall within the specified output filter
band will be displayed and recorded. In order to avoid an unnecessarily long list
of inband spur products, the 1 xi spurs are not recorded. If at least one occurrence
is encountered, then the appropriate "X", "Y", or "Z" is displayed in the output
spur table and a note is made in the output file. Frequency inversion must be considered
when choosing the LO frequency.
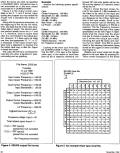
Highest RF and LO Harmonics
Enter values for the highest harmonics to be used when calculating the spurious
product frequencies. The largest spur order to be calculated will equal the highest
RF harmonic added to the highest LO harmonic. Separate values are allowed for the
two highest harmonics since computation time and the size of the spur product file
are highly dependent on both values. Many times high order LO harmonics are more
important due to leakage of the usually higher input power of the LO (+13 dB or
more greater than maximum RF, typically). The output spur table will display those
products which are generated by the mixing process from 0 to the highest harmonic
values entered. The zeroth harmonic represents the DC (direct current) component,
if any. Calculation time and the output spur list can be shortened by
|
Figure 3 - SPURS output screen.
|
|
choosing the lowest harmonic necessary to achieve the required mixer spurious
suppression.
For instance, if all RF harmonic spurs above the 5th and all LO harmonic spurs
above the 7th are suppressed below the system requirement, then test only for up
through the 5th RF harmonic and the 7th LO harmonic.
Steps for Input Frequency
The input frequency is stepped through the range entered in the Input Frequency
line. Entering a number of steps of 1 would include the low and high frequencies
only. Be sure to include enough steps to assure all of the possible inband spur
occurrences. For example, to include a specific frequency point of, say, 70 MHz,
when the low frequency is 10 MHz and the high frequency is 100 MHz, enter 9 for
the number Input Frequency Steps. The sixth step will be at exactly 70 MHz. The
frequency step size can be calculated thusly:
Frequency =
(fHIGH - fLOW) / Steps for
Input Frequency
= Bandwidth / Steps for
Input Frequency
Frequency steps are usually easier to visualize without a calculator when the
input and output frequencies are entered in the center frequency and bandwidth form.
For example, a bandwidth of 9 MHz (see above example) with a number of steps of
9 results in a 1 MHz step size.
|
Steps for LO Frequency
The LO frequency is stepped through the range entered in the LO Frequency line.
Entering a number of steps of 1 would include the low and high frequencies only.
Be sure to include enough steps to insure all of the possible in band spur occurrences
are found. Typically, the LO will not need to be stepped in as small of a frequency
increment as will the input. Three or four points within the narrowest passband
should suffice. For example, if the input has a BW of 20 MHz and the output has
a BW of 60 MHz, then four steps in each 20 MHz band would result in:
60/20 = 3 bands → 3x4
= 12 LO steps
Spur Table Output Screen
Inband spurious mixer products which fall within the output filter band are represented
in the spur table by an "X" if the spur was created by a jLO ± kRF product, by a
"Y" if created by a kRF ± jLO product, or by a "Z" if created by . both an "X" and
a "Y" type product. A "-" occurs in each harmonic location not taken by "X", "Y",
or "Z", and indicates the highest harmonic tested per the input parameter screen.
If CURRENT.MXR, the mixer spur level file, was successfully read in during program
start-up, pressing F9 will display the corresponding power level (-dBc) relative
to the 1 xi product. Also displayed will be the mixer model number and the RF and
LO input power for
|
|
which the levels are valid, as specified in CURRENT.MXR. Conversion loss is not
accounted for in the level unless accounted for in CURRENT.MXR.
Figure 3 is the output screen spur table in the X, Y, and Z format. Upon quitting
the program you may review the results with a standard text editor or viewer.
Along with the spurious information, at the beginning of the file the file name,
time, and date plus all of the input parameter data is saved. The desired spurious
product usually occurs for j = 1 and k = 1; therefore, since it occurs most often
it is not included in the output spur list. However, if it does occur at least one
time, the appropriate "X", "Y", or "Z" is displayed in the output screen spur table
and a statement is inserted into the output hard copy or disk file. Figure 4 shows
the format.
The output file format is convenient for importing into other programs for post-processing
such as graphing.
|
Example
Assume the following system specifications:
Input: Center Frequency: 150 MHz
Bandwidth (0.1 dB) : 20 MHz
(3.0 dB) : 25 MHz
(40 dB) : 40 MHz
Max Power: -10 dBm LO Power: +10 dBm
Output: Center Frequency: 500 MHz
Bandwidth (0.1 dB) : 20 MHz
(3.0 dB) : 25 MHz
(50 dB) : 40 MHz
Inband Spurious: -60 dBc No Frequency Inversion
Looking at the mixer spur level data for EXAMPLE.MXR in Figure 5 shows that the
5RF x 7LO spur is the highest order spur in the matrix to have less than 65 dB of
rejection; therefore, the
|
highest RF harmonic tested will be the 5th and the highest LO harmonic tested
will be the 7th. Figure 1 shows the input screen format for the ripple (0.1
dB) bandwidth of the filters to be used on the input and output. Recommended LO
frequencies are displayed at the bottom right-hand side of the input screen. Since
no frequency inversion can be tolerated, the low-side (LS) LO frequency of 350.00
is selected. The No Frequency Inversion message assures that part of the output
specification will be met. Figure 4 represents what the output disk file would look
like if printed or saved to disk. Figure 3 shows the output spur table. Choosing
the save file option and naming the file "2020" (the BW's) would result in the following
information being stored on the logged on drive and directory (Figure 4):
Relative spur power levels can be displayed in the spur table by pressing F9.
Those levels correspond to the levels
|
|
Figure 4 - SPURS output file format.
|
Figure 5 - An example mixer spur level file.
|
|
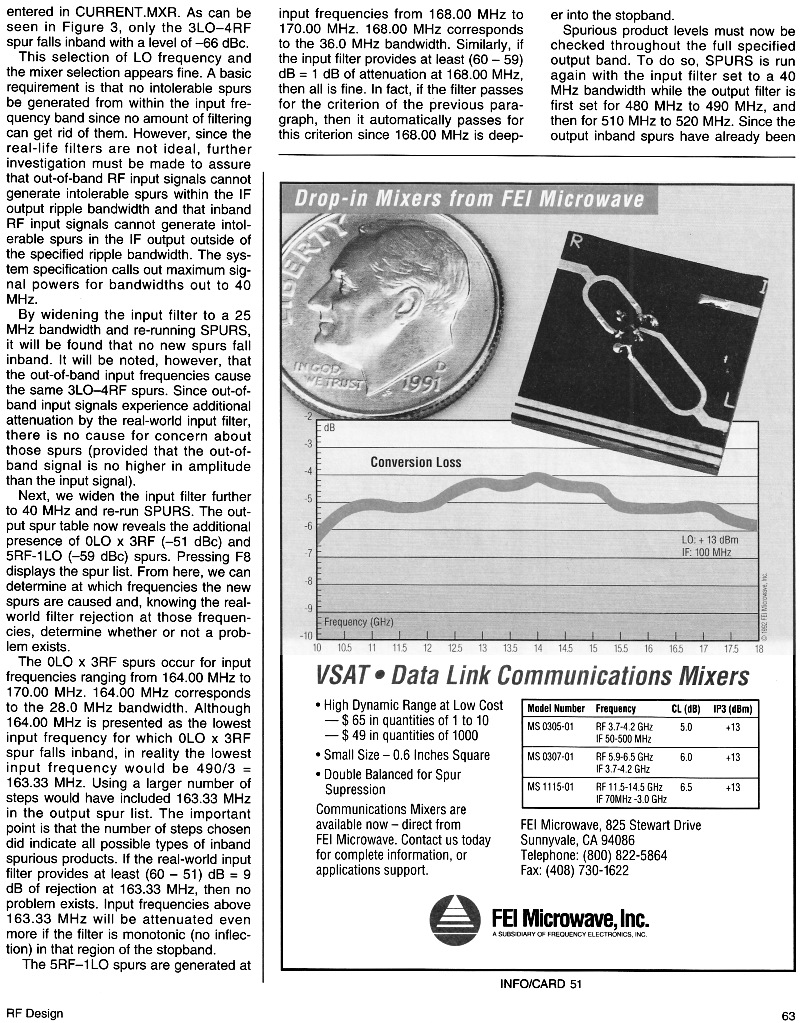
entered in CURRENT.MXR. As can be seen in Figure 3, only the 3l0-4RF spur falls
inband with a level of -66 dBc. This selection of LO frequency and the mixer selection
appears fine. A basic requirement is that no intolerable spurs be generated from
within the input frequency band since no amount of filtering can get rid of them.
However, since the real-life filters are not ideal, further investigation must be
made to assure that out-of-band RF input signals cannot generate intolerable spurs
within the IF output ripple bandwidth and that inband RF input signals cannot generate
intolerable spurs in the IF output outside of the specified ripple bandwidth. The
system specification calls out maximum sigal powers for bandwidths out to 40 MHz.
By widening the input filter to a 25 MHz bandwidth and re-running SPURS, it will
be found that no new spurs fall inband. It will be noted, however, that the out-of-band
input frequencies cause the same 3l0-4RF spurs.
Since out-of-band input signals experience additional attenuation by the real-world
input filter, there is no cause for concern about I those spurs (provided that the
out-of-band signal is no higher in amplitude than the input signal). Next, we widen
the input filter further to 40 MHz and re-run SPURS. The output spur table now reveals
the additional presence of 0LO x 3RF (-51 dBc) and 5RF-1LO (-59 dBc) spurs. Pressing
F8 displays the spur list. From here, we can determine at which frequencies the
new spurs are caused and, knowing the real-world filter rejection at those frequencies,
determine whether or not a problem exists. The 0LO x 3RF spurs occur for input frequencies
ranging from 164.00 MHz to 170.00 MHz. 164.00 MHz corresponds to the 28.0 MHz bandwidth.
Although 164.00 MHz is presented as the lowest input frequency for which 0LO x 3RF
spur falls inband, in reality the lowest input frequency would be 490/3 = 163.33
MHz.
|
Using a larger number of steps would have included 163.33 MHz in the output spur
list. The important point is that the number of steps chosen did indicate all possible
types of inband spurious products. If the real-world input filter provides at least
(60 - 51) dB = 9 dB of rejection at 163.33 MHz, then no problem exists. Input frequencies
above 163.33 MHz will be attenuated even more if the filter is monotonic (no inflection)
in that region of the stopband. The 5RF-1 LO spurs are generated at input frequencies
from 168.00 MHz to 170.00 MHz. 168.00 MHz corresponds to the 36.0 MHz bandwidth.
Similarly, if the input filter provides at least (60 - 59) dB = 1 dB of attenuation
at 168.00 MHz, then all is fine. In fact, if the filter passes for the criterion
of the previous paragraph, then it automatically passes for this criterion since
168.00 MHz is deeper into the stopband.
Spurious product levels must now be checked throughout the full specified output
band. To do so, SPURS is run again with the input filter set to a 40 MHz bandwidth
while the output filter is first set for 480 MHz to 490 MHz, and then for 510 MHz
to 520 MHz. Since the output inband spurs have already been to be of no consequence,
including the center 20 MHz frequencies in the final analysis would only make the
output spur list longer and more difficult to interpret. Running SPURS once for
the lower band and once for the upper band makes more sense. Running SPURS for the
lower side of the output band to the 40 MHz bandwidth results in the 0LO x 3RF (-51
dBc), 5RF-1 LO (-59 dBc), and the 310 - 4RF (-66 dBc) spurs showing up. Since they
all are less than the required -50 dBc, output filtering for the low side is good
regardless of the input filter rejection.
|
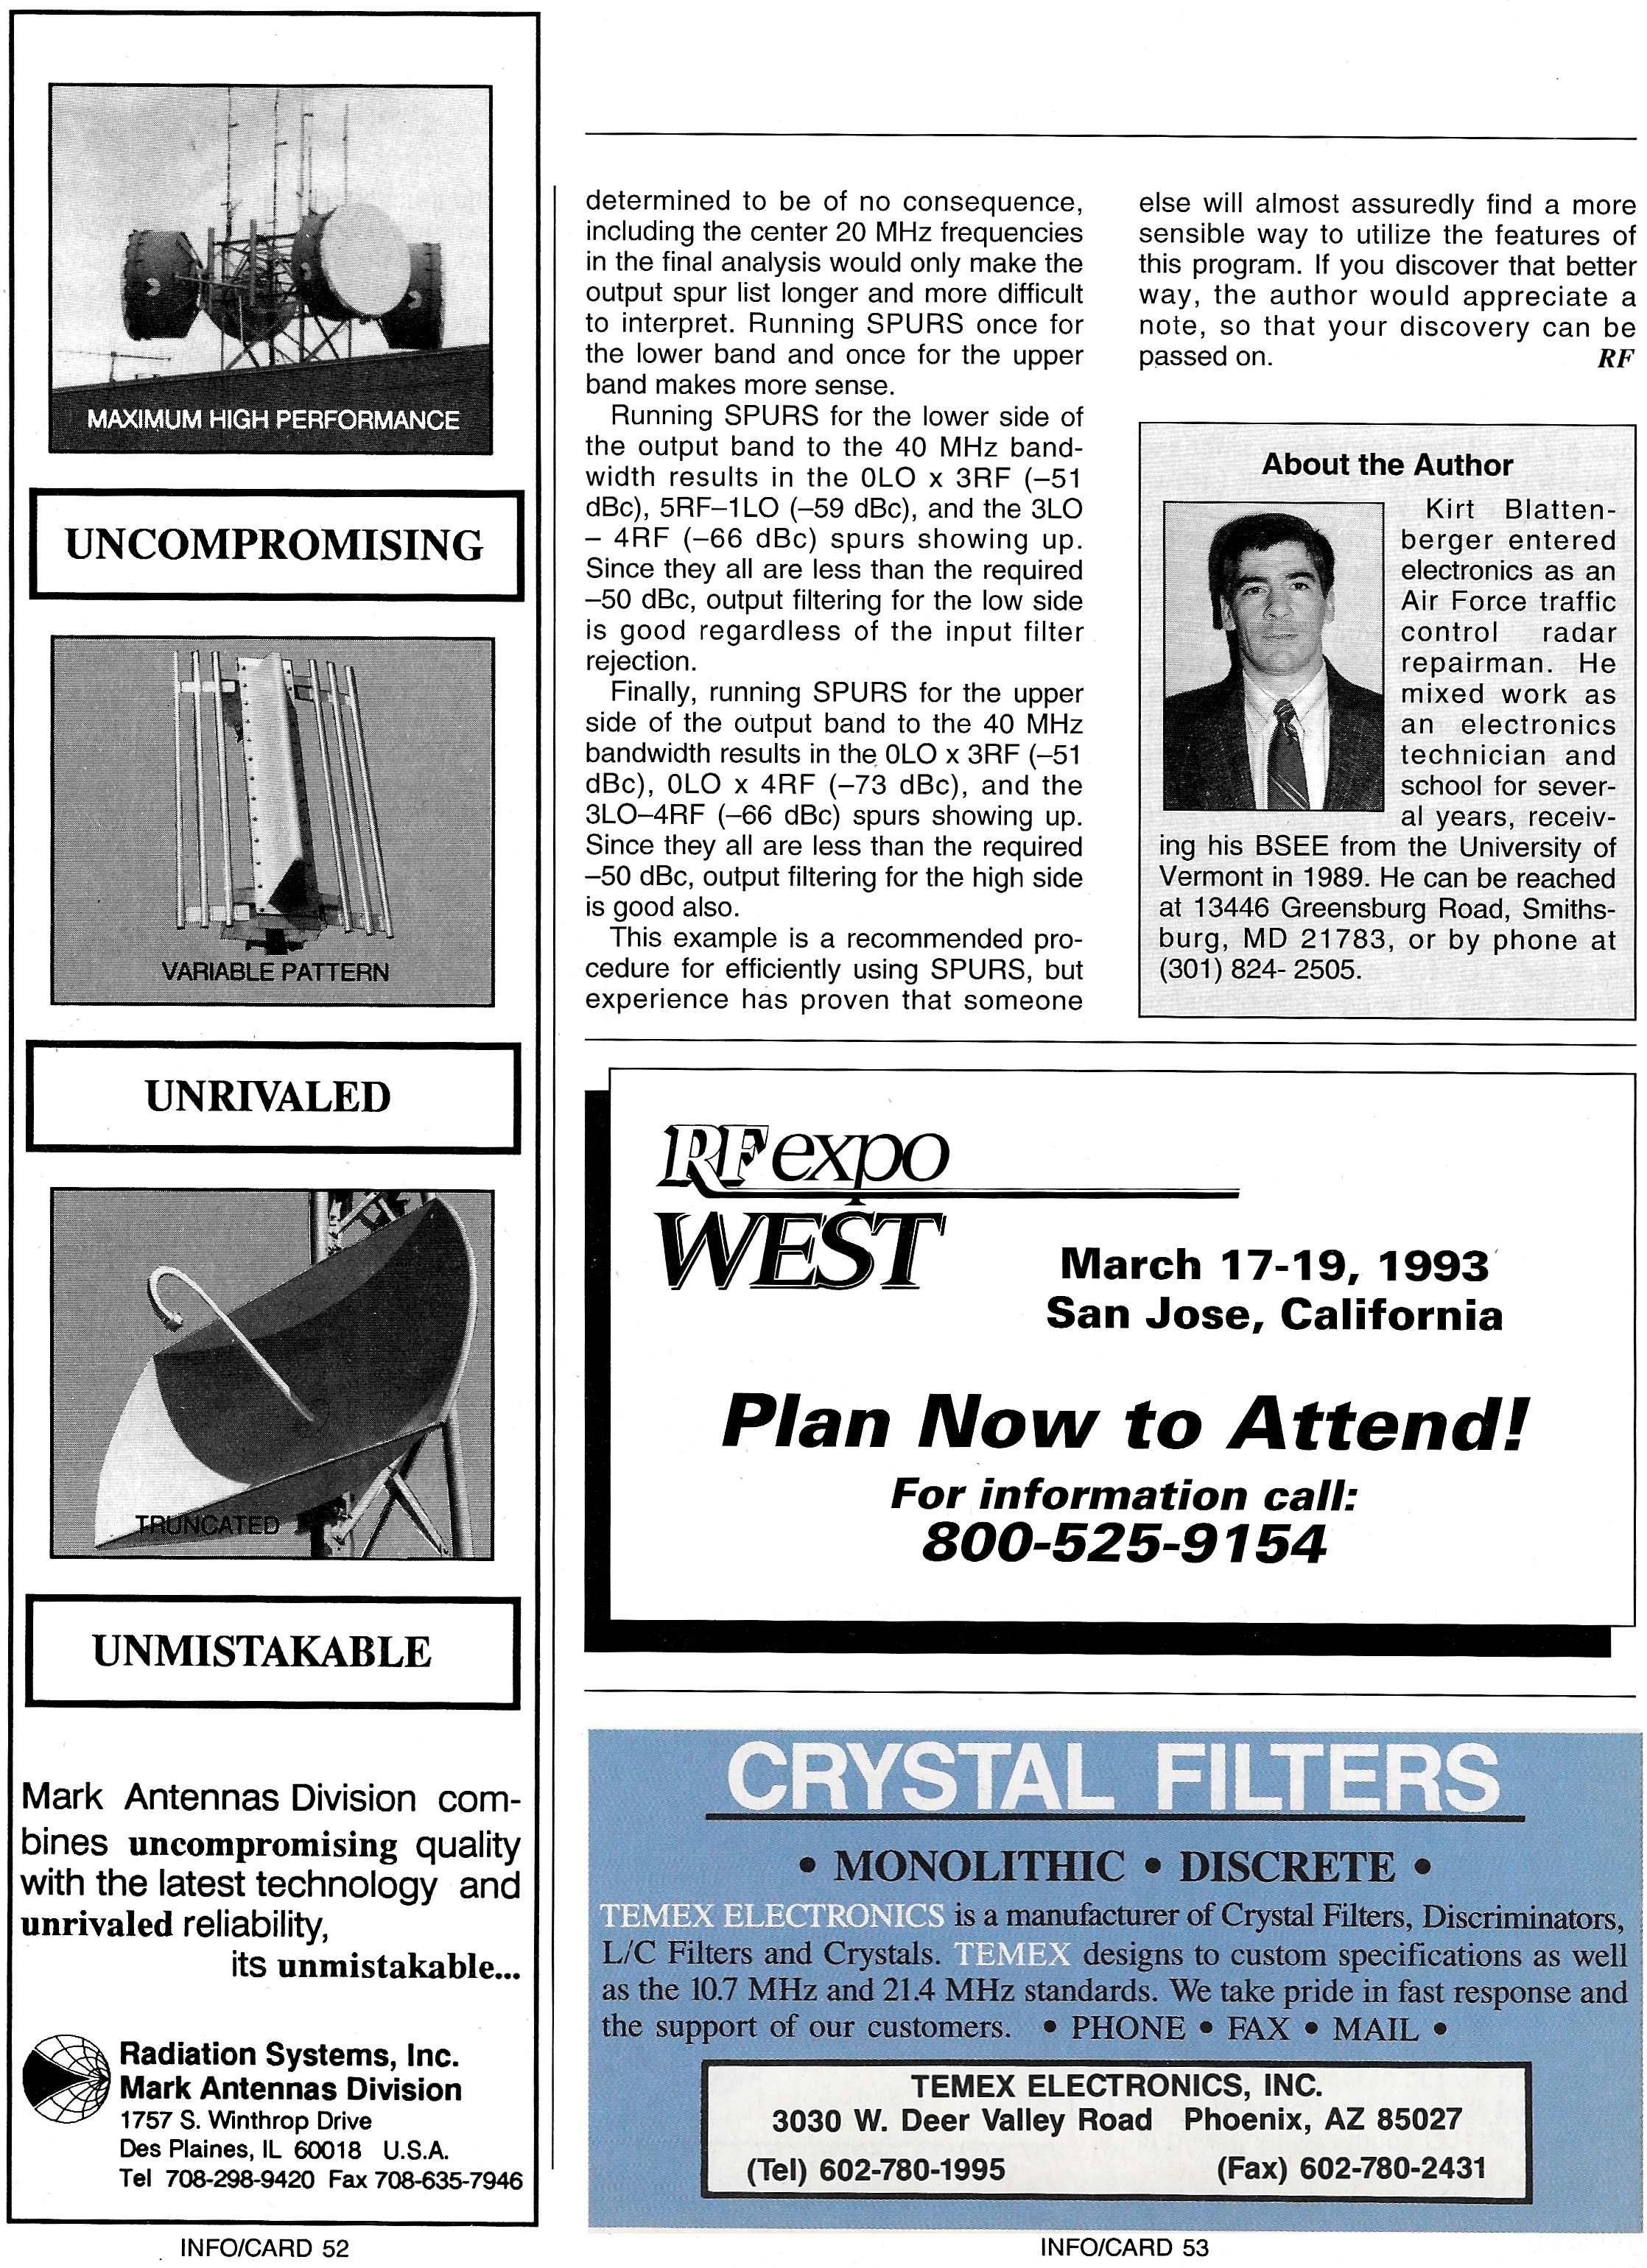
Finally, running SPURS for the upper side of the output band to the 40 MHz bandwidth
results in the 0LO x 3RF (-51 dBc), 0LO x 4RF (-73 dBc), and the 3LO-4RF (-66 dBc)
spurs showing up. Since they all are less than the required -50 dBc, output filtering
for the high side is good also. This example is a recommended procedure for efficiently
using SPURS, but experience has proven that someone else will almost assuredly find
a more sensible way to utilize the features of this program. If you discover that
better way, the author would appreciate a note, so that your discovery can be passed
on.
|
About the Author
 Kirt Blattenberger entered electronics as an
Air Force traffic control radar repairman. He mixed work as an electronics technician
and school for several years, receiving his BSEE from the University of Vermont
in 1989. He can be reached at 13446 Greensburg Road, Smithsburg, MD 21783, or by
phone at (301) 824- 2505. Kirt Blattenberger entered electronics as an
Air Force traffic control radar repairman. He mixed work as an electronics technician
and school for several years, receiving his BSEE from the University of Vermont
in 1989. He can be reached at 13446 Greensburg Road, Smithsburg, MD 21783, or by
phone at (301) 824- 2505.
Note: Contact info is outdated.
Re-posted July 27, 2020

You are welcome to submit yours.
|
|
Here are the pages from the original printing:
Posted July 23, 2021
|